Case Study
1. Introduction
Distributed systems will inevitably fail. It could be the code in a microservice, the machine it lives on, or the network it connects to. What matters is how quickly developers can identify and repair the problem. However, these systems become more complex and decentralized every year, increasing the difficulty of tracking down bugs.
When applications live on separate machines, developers need a single tool that can tell them where to start looking. By applying distributed tracing, developers can see how requests move through their system, revealing why a transaction did not go as expected. Although tracing does not give an exact answer, it does narrow the field of investigation.
While distributed tracing simplifies back-end debugging, the number of ways a customer can break applications from the browser has increased exponentially. Developers need tools that can account for the interaction between front-end UI and back-end services. Fortunately, tools like session recording can give developers an exact reproduction of the user session rather than relying on user feedback. This in tandem with distributed tracing speeds up the debugging process for modern applications.
We cannot guarantee systems will work as expected, but we can help you fix them faster.
1.1 What is Retrospect?
Retrospect is an open-source full-stack observability tool. It abstracts away the complexity of distributed tracing and session replay, so developers can spend more time fixing bugs than finding them.
In this case study, we will describe how we designed and built Retrospect, along with some of the technical challenges we encountered. But first, let’s start with an example of debugging modern applications.
1.2 Bob's Shop: An Example User Story
Imagine you run a small e-commerce application, Bob's Shop. The application uses a microservices architecture, so when a customer checks out, requests get sent to the Authenticate, Inventory, Payment, and Shipping services.
But systems break. In this case, the customer could not check out and filed a complaint with Bob.
![]()
Debugging without Observability Tools
First, Bob might ping each of the services to verify that they're still up. In a large application with many services, this can be a daunting task, but fortunately for Bob, there are only four. Unfortunately for Bob, all the services are up.
![]()
Next, Bob checks his services' logs, hoping to find a 4xx or 5xx response that will point to the bug.
![]()
These logs are hard to read at best, and their quality depends on the person who set them up. If he were lucky, Bob would find a log entry pointing to the problem, but that is not the case here.
After investigating the logs, Bob tries to reproduce the error himself and asks the customer for more details about what they did in the browser. The customer does not respond though, which means even if Bob tried reproducing the error, its effectiveness would be limited.
As we can see, bugs that involve both the front and back-end are extremely difficult to debug because Bob needs insight across an entire network. When the back-end is also a microservice architecture, the problem is compounded.
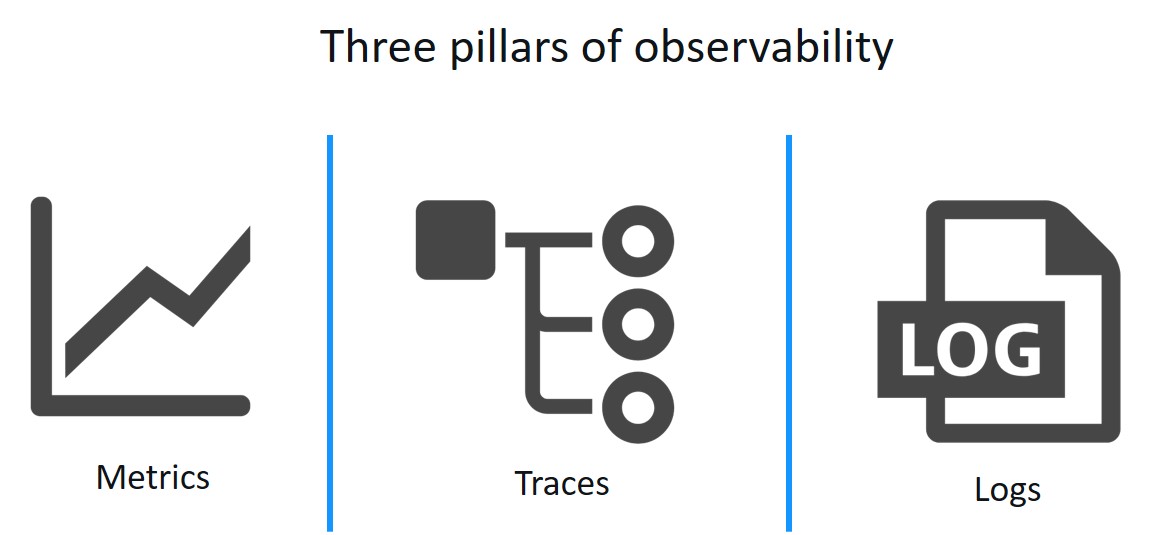
2. Observability
What Bob needs is an observability tool. Observability is a set of tools and techniques for understanding what is happening inside of a system by gathering data as it runs.
![]()
Metrics are numeric values over time, for example, requests per second, average response time, status code frequency. These can indicate if your system has a problem by illustrating irregular patterns. Metrics could answer the question, “How many times has a service gone down?”
Logs are records of events that happened at a particular time including contextual information. These can tell you what the problem was, once you’ve found the right logs. For example, logs could tell you what happened immediately before a service went down.
2.1 Tracing
In modern, distributed architectures, tracing is critical. Finding the problem is more than half the battle and is a prerequisite to using logging effectively. Modern applications are often too complex to know where the right logs are.
![]()
A helpful analogy here is the game Telephone. Like back-end debugging, the problem with Telephone is that observers don't know what happened between the initial request/phrase and the response/final phrase. The people/services are black boxes.
When Bob's customers use his application, they are essentially playing telephone with his microservices. Normally phrases are successfully transmitted through the network, but a bug means the customer's input was distorted somewhere in the architecture.
If a developer had to debug an actual game of Telephone, they could simply ask each player what they said. Unfortunately, when debugging web applications, the user can’t tell you exactly what they said and the microservice "players" don't remember everything they have said.
Tracing solves this problem by giving the user a piece of paper with instructions to write down their name and phrase. When the game starts, that paper gets passed to the next person/microservice, and so on. As a result, if the transmission fails, a developer can find that piece of paper, check the names and phrases, and identify where the transmission went wrong.
To extend this analogy, logging would be equivalent to handing each player their own piece of paper/log and having them write down everything they say. The paper/log never gets passed to the next person, so the relationship between different service responses is ambiguous. As a result, when something goes wrong, a developer still has to check all the players/services and read through their entire paper/log. Even if each service has its own logging, tracing is a prerequisite.
2.2 Tracing Bob's Shop
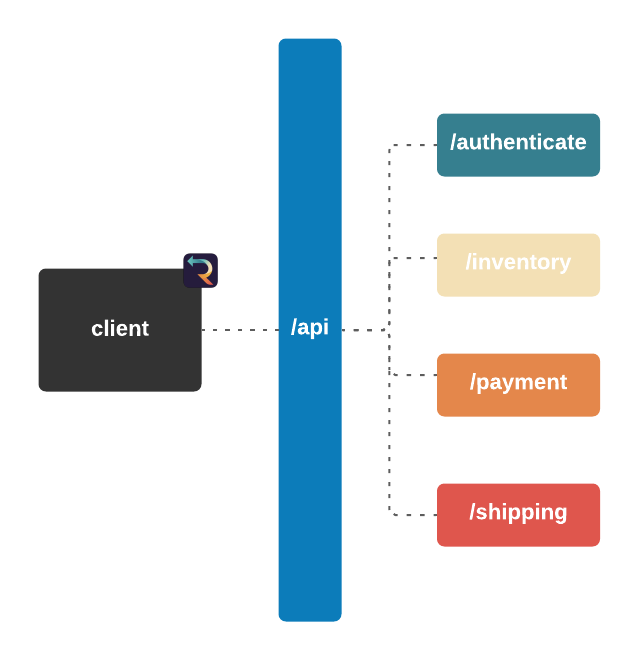
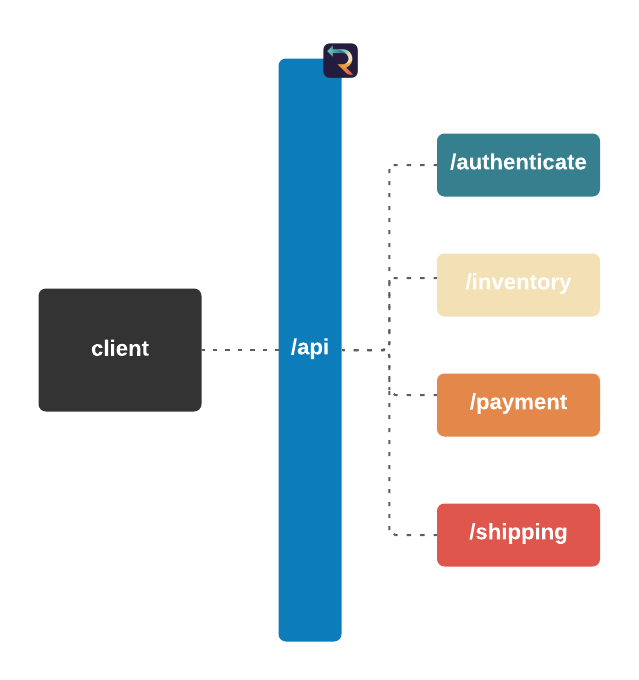
The Telephone analogy makes sense with people, but what does tracing mean in the context of Bob's Shop? Consider the following system diagram containing all of Bob's services.
![]()
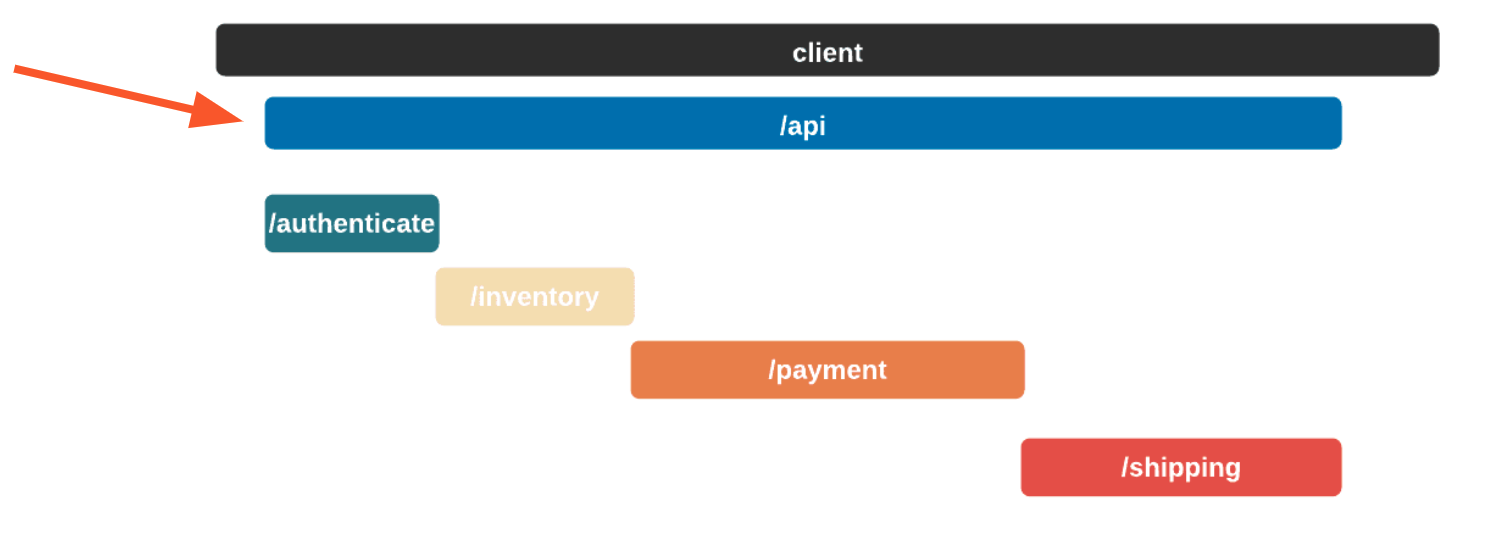
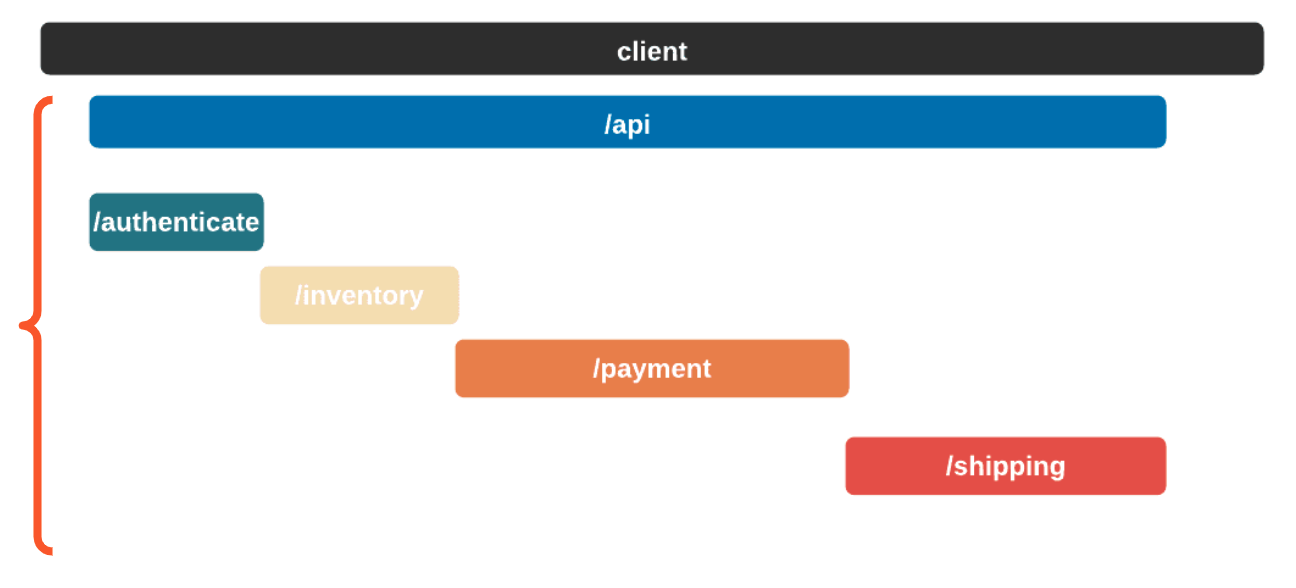
When a user places an order, multiple actions take place: the user is authenticated, inventory is verified, payments are validated, and orders are shipped. And while the diagram shows that a relationship exists between these services, it does not provide any information about that relationship.
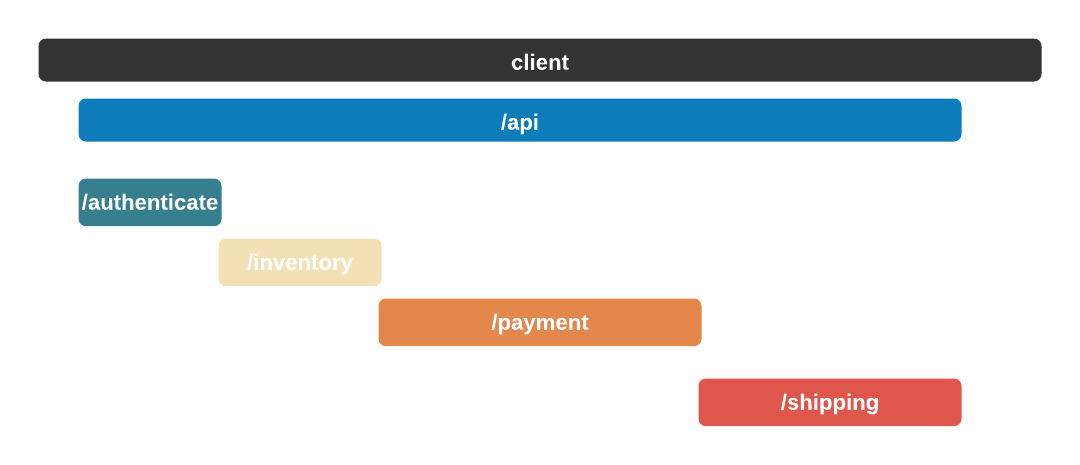
A service trace makes it clear how services relate to one another in terms of time and necessity. Length and position show how long a service takes and in what order services need to be called.
![]()
In this case, the authenticate service was called first, followed by the inventory service. The payment service could not start until the inventory service had finished. Once the shipping service was finished, the api service could return. A service trace can be thought of as a system diagram over time.
![]()
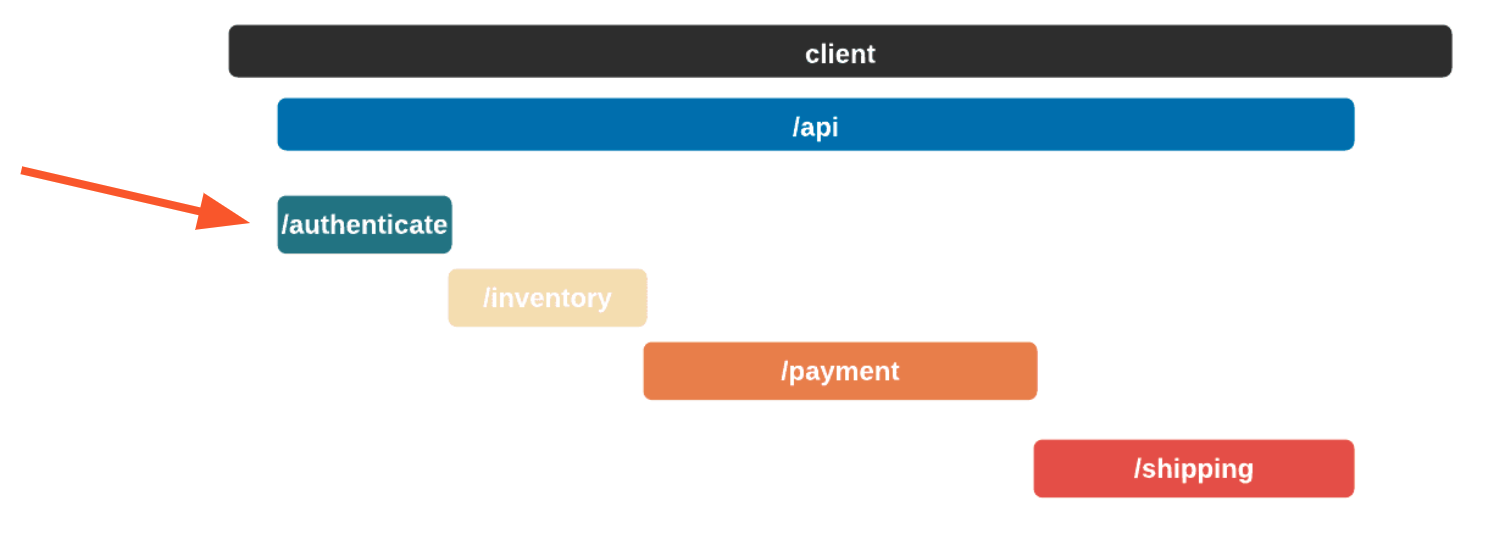
2.3 Tracing Terminology
Span
I want to know where a request went, what data it held, and how long it took.
A span is a single operation within a trace.
![]()
Root Span
I want to know the first request to hit my architecture.
A Root Span is a span that encompasses an entire set of child spans. In other words, a Root Span measures the time it took from a user sending a request to the request flow being completed or failing.
![]()
Trace
I want to see a complete execution path of a single request.
A Trace is a view into a single request as it moves through a distributed system. It is the list of all spans descended from a particular Root Span. It can identify which parts of the code are causing issues like errors, latency concerns, or resource availability.
![]()
3. Existing Solutions
How can Bob achieve a sufficient level of observability using existing solutions?
One avenue for Bob is an enterprise solution. SaaS vendors such as Sentry, Datadog, and New Relic would provide a way to see back-end traces in the context of front-end events as demonstrated. These enterprise solutions offer not only observability for traces, but also logs and metrics, making them feature-rich.
However, the ease of outsourcing observability to a SaaS vendor comes at the cost of a lack of data ownership and recurring fees. In the case of a small company like Bob's where capital may be low, it may be better to allocate those fees to other expenses and use a solution that provides just the essential features for debugging a small microservice-based application.
Another option for Bob is to go with a DIY solution. Bob can use open source solutions dedicated to recording front-end events and back-end traces. The most prominent open source solutions for recording these include rrweb (a web session recording library) for the front-end events and OpenTelemetry (an observability framework for collecting telemetry data) for the back-end traces.
However, Bob would have to spend time learning how to use these open source solutions properly. Moreover, they do not integrate with each other out of the box, so Bob would have to find a way to customize rrweb and OpenTelemetry such that the front-end events will be connected to the back-end traces they correspond to. The time and energy Bob would expend to get a DIY solution set up could be better spent on the core functionality of his application.
What if there was a solution that offered the ease of deployment offered by enterprise while also providing the benefits of DIY? This is where Retrospect fits.
![]()
Retrospect connects the related events and traces of the instrumented application out of the box thanks to its ready-made pipeline. The user will retain data ownership as the database instance is deployed in the environment of their choosing, and it comes with a simple yet powerful UI for debugging small microservice-based applications.
While it will not give you real-time performance analytics or the trend of your website's conversion rates, it will provide you with the context necessary to figure out what service to investigate.
4. Debugging with Retrospect
We return to Bob's e-commerce application, this time using Retrospect. It is identical to the original application except now Retrospect is collecting data from the browser and back-end.
![]()
Again, Bob's application breaks and the customer cannot check out. They file a complaint with Bob.
![]()
Again, after receiving the complaint, all Bob knows is the user's email ([email protected]) and that the checkout process failed. Let's see how Bob could use Retrospect to debug this issue.
First, Bob will search for records associated with the customer's email, "[email protected]".
![]()
Second, Bob sorts the resulting records by time. Although the complaint did not give an exact time, he knows the failed checkout must have happened recently. When he clicks on the first result, it reveals a more detailed view.
![]()
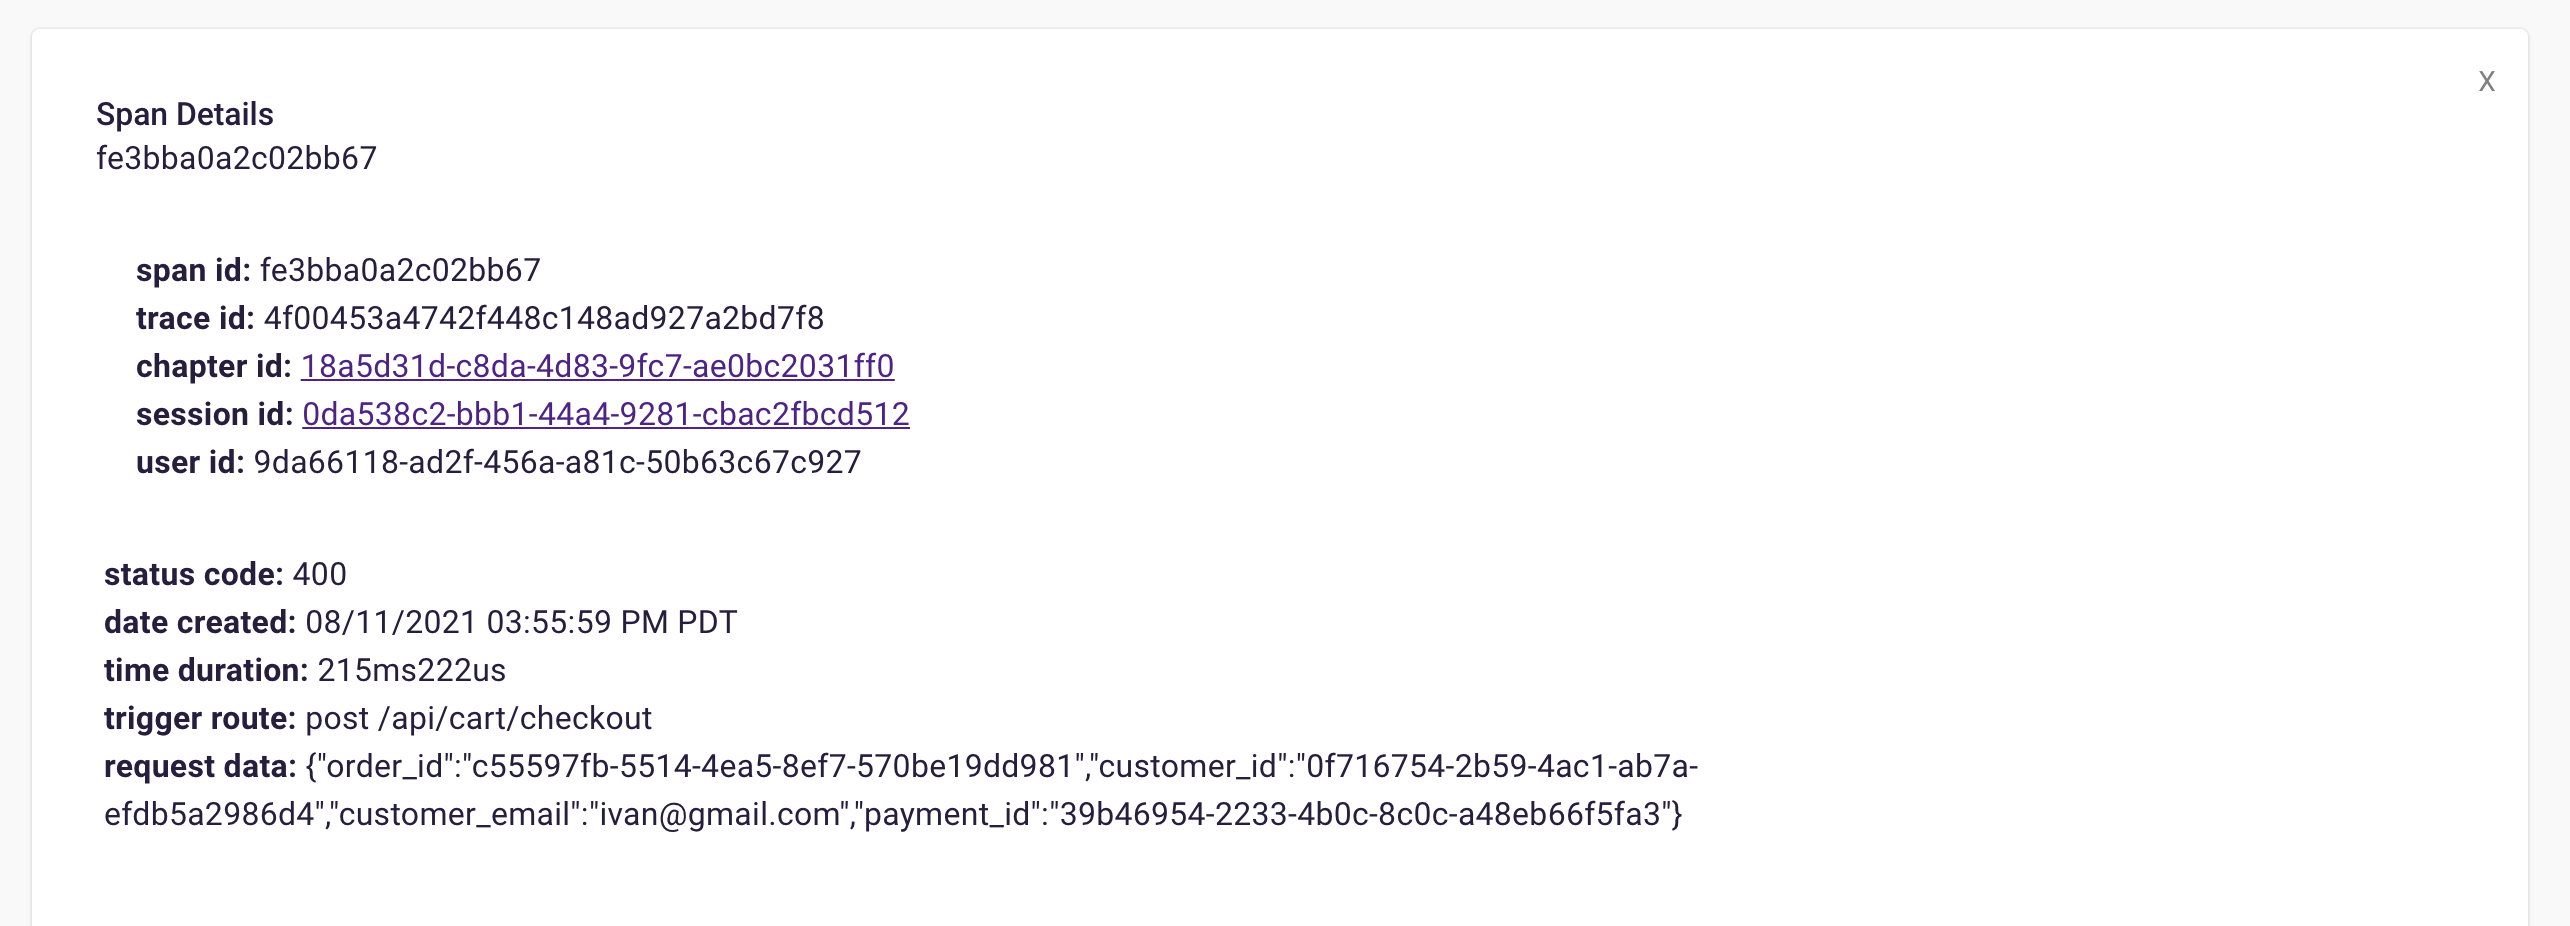
If we take a closer look at the details card, we can see several interesting pieces of information. First Bob would recognize that the waterfall chart at the top of the card looks wrong. It only has three bars where normally the checkout process would show five. Further down, he sees that the response to the customer had a status code of 400, confirming that an error occurred. Finally, he can see the user's email as a property of the request data object.
![]()
Next, Bob will click on the chapter ID to get a broader view. We will explain what chapters and sessions mean in a later section, but for now, it is sufficient to think of chapters as a set of back-end records and front-end browser events. In this case, nothing on the chapter page immediately explains what went wrong.
![]()
Bob remembers that the waterfall chart seemed too short. Typically if something has gone wrong, it will have happened in the last recorded service, so Bob clicks on the latest bar in the chart. This reveals that a request was sent to the inventory service, the inventory_not_available endpoint, and that it returned a 200.
![]()
At this point, Bob has questions. Why did the checkout process stop at the inventory service? How could a customer even reach the checkout page, if the inventory was unavailable? To answer these questions, Bob needs more information about what the customer did in the browser before checking out. Unfortunately, the customer did not provide any additional details in their complaint, and they are not responding to Bob's questions. If this were a normal tracing tool, Bob would be at another dead end. Fortunately, Retrospect gives Bob another option.
Bob clicks on the session ID link. The session page gives Bob an exact reproduction of what the customer did on the site, rebuilt from dehydrated DOM snapshots taken of the browser. It also displays all the requests initiated by the customer. This is a massive increase in Bob's understanding of the problem. For example, Bob can now see exactly which inventory the customer added to the cart before clicking the checkout button.
![]()
Skipping to the end of the recording, Bob can also check that the customer used the correct name when they were checking out. Although he has configured Retrospect to not record Ivan's credit card information, Bob can see that the name on the card matches the user. Additionally, he can see that the customer clicked the checkout button multiple times without success.
![]()
At this point, Bob has two key pieces of information:
-
The checkout process stopped after the inventory service (based on the back-end recording)
-
The customer was trying to checkout apples and cherries (based on the front-end recording)
With this in mind, Bob goes back to the session replay.
![]()
And there it is. Bob realizes something impossible has happened. The customer was able to add cherries to their cart, even though there are 0 left in stock. Out-of-stock products should not even be visible on the products page, let alone be added to the cart. Something has gone wrong with this front-end code, and maybe the related back-end code as well. While Bob does not know the exact line of code that caused this bug, he now has a solid starting point.
5. How Retrospect Works
In short, Retrospect is a full-stack tracing tool for small microservice-based applications.
It is comprised of 6 pieces that work together to collect, connect, and select back-end traces and front-end events.
![]()
Let's take a closer look at the different architectural components.
5.1 Collect
Client Agent
The client and server agents are responsible for collecting event and span data from the instrumented application and sending it to the api server. For the client agent, we used the open-source web session recording library, rrweb, with modifications to attach metadata onto requests.
This allows us to connect recorded events to spans later in the pipeline. We’ll talk about this more later, but essentially Bob adds the client agent code to whatever code is rendered in the user’s browser.
rrweb
rrweb records every front-end event and periodically snapshots the entire DOM before serializing the data for storage. To do this, it uses the MutationObserver Web API, which watches for changes to the DOM and executes a callback when a change occurs. rrweb transforms the resulting data into a legible JavaScript object, an event, which Retrospect sends to our API server.
In addition to recording individual DOM change events, rrweb will also periodically record the state of the entire DOM in the form of nested objects. These objects contain an id property and a record of what type of node they refer to, which rrweb can use to reconstruct the DOM as part of its replayer. Even though the list of events would be sufficient for debugging in most instances, Retrospect also stores these full DOM snapshots because there are cases where full session replay is beneficial.
Despite its value, recording every change to the DOM can also become computationally expensive if done poorly, slowing down the instrumented app as CPU time is allocated to recording and sending events rather than native application logic. As a result, rrweb processes the events asynchronously to avoid taking up excessive CPU time and allows you to specify which events you do not want to track.
In the case of Retrospect, we opted to not record mouse movements by default because these generate a large volume of event records. This not only affects the instrumented application but also imposes a cost on our downstream infrastructure in the form of higher write volumes.
Server Agent
For the server agent, we used the open-source observability framework, OpenTelemetry (with modifications to pull metadata off of incoming requests and propagate them in the subsequent trace). This allowed us to collect span data from instrumented applications. In this case, Bob would add the server agent code to every service he wants to trace that calls another service.
OpenTelemetry
The power of distributed context propagation is that it achieves the propagation of metadata without any changes to the services that pass this metadata.
OpenTelemetry works through a process called context propagation. It is what allows us to associate spans with their traces, traces with their chapters, and chapters with their sessions. The context object contains values like trace ID, chapter ID, and session ID, which are passed around within a service. Propagators are responsible for passing those context values onto the next service.
For Retrospect, we created a Custom Span Processor which allowed us to add additional metadata to each span's context object before exporting it to our back-end.
Having access to these values at any point in the transaction is what makes distributed tracing work.
We chose OpenTelemetry because it is has a Node.js SDK that provides automated instrumentation and tracing for Node.js applications which uses intelligent agents that are attached to the running application and extracts tracing data. This automated instrumentation works at the service level, deploying opentelemetry packages alongside the application's code. It requires no code changes. We chose automated instrumentation because it was most appropriate for our use case. A user like Bob does not have the time or personnel to manually instrument every microservice.
![]()
Instrumenting an application means extracting and collecting trace data from each service as they execute. Auto instrumentation eliminates the need for adding lines of code throughout your application to extract and collect trace data.
Here is a closer look at the agents at work in Bob's application.
![]()
When a user visits Bob's app, the Retrospect Client Agent takes full DOM snapshots and listens for DOM mutation events and mouse clicks. It sends these dehydrated events to the Retrospect API after attaching the metadata required for connecting them to their respective traces recorded by the Retrospect Server Agent.
When the user triggers an http request to Bob's back-end, the Retrospect Server Agent creates the span that will be passed along the microservices involved in the http request. This span is the pencil and paper from the telephone analogy, and our Retrospect middleware attaches the metadata required for connecting each span to the user session that triggered their http request before they are sent to the Retrospect API.
5.2 Connect
The 3 pieces for the connect group are the API server, an instance of a Cassandra database, and a server containing scheduled data maintenance tasks.
![]()
The API server receives the data from the agents and transforms the contents for easier querying before sending it to Cassandra. It also serves data to the UI by making CQL queries to Cassandra.
Cassandra is our datastore of choice. This design decision will be covered in greater detail later, but in short, we chose Cassandra due to the high volume of events Retrospect would consume from the instrumented application.
The Scheduled Tasks server contains cron jobs that maintain the database by purging data older than a set number of days configurable by Bob. It also solves a technical challenge we faced with using the current implementation of OpenTelemetry, as the metadata isn't propagated properly to database spans. The API places these unidentified database spans in a buffer within Cassandra, where they'll stay until their requisite metadata is attached to them by the cron jobs.
5.3 Select
The last piece of Retrospect is our UI. We designed the UI to have a good balance between simplicity and power while also thinking about the user experience. Our design decisions for our UI were driven by us ourselves developing Bob's microservice-based application, instrumenting it with Retrospect, and inducing errors in Bob's different microservices. We also consulted working developers to make sure our UI had the features they thought necessary. The result was a UI that was quite fun to use internally.
![]()
It may not have all the bells and whistles of the bigger enterprise solutions, but we aren't aiming to be a complete 3-pillars observability solution. Our focus is on the traces generated by your architecture - to give your microservices the paper and pencil in their game of telephone.
6. Design Challenges
The first technical challenge to providing a simple full-stack tracing tool was connecting data generated by rrweb and OpenTelemetry. These are off-the-shelf usable, and they work well within their domains: rrweb records and exports browser events with options for configuring the amount and type of events that we record and OpenTelemetry is the industry standard for collecting telemetry data.
We didn't want to reinvent the wheel, and with two amazing solutions in play, these two tools became immensely desirable to us when we began investigating solutions.
6.1 Connecting Events and Traces
When we were prototyping Retrospect, we set rrweb and OpenTelemetry to export data into a MongoDB instance. We had front-end and back-end data. Except, here's what the data looks like:
![]()
Even though these two technologies complement each other incredibly well, they don't talk to each other natively. Trace and event data did not share any identifying metadata like chapter or session IDs. It would be impossible to identify the events and traces that occurred in the same user session, let alone determine which events preceded a specific trace.
Further, they don't have native, built-in adapters to work with each other, which means we had to experiment with ways to connect the two.
Adding Context
While OpenTelemetry ties spans together with a context object, the event streams generated by rrweb lack context. "User clicked" gets recorded by the front-end, and "some services talked to each other" gets recorded by the back-end. Nothing connects those events to OpenTelemetry's traces. And so, we needed to create and attach contextual information.
Perhaps the most immediately apparent method of organization is to organize by time, which certainly is valuable, but does not account for other data. If ten people do ten different things, and you log each thing, you can tell the order in which the people did things. However, you can't tell which person did which thing. We need context that connects a person to a thing.
The next method of organization might be the concept of a user ID. This is valuable, yes; but still not granular enough. Even if we know which events and traces were generated by a specific user, that user ID will be associated with months or even years worth of data. Is there a more granular unit of time?
Session IDs
Borrowing from how cookies help webservers to 'remember' a particular browser session, we decided that a client would generate a unique session identifier, and pass this along with all the event-logging requests, and attach it to the back-end requests. The session ID would be reset when the browser's session storage clears, or after 30 minutes. The time limit was introduced to limit the amount of data generated by idle users.
For front-end events, implementing session IDs was straightforward. We intercepted axios and fetch requests and added the session ID as a custom header. With this change, the event data exported by rrweb and the requests sent to the back-end share a session ID. This meant that OpenTelemetry would have access to the session ID as well.
However, OpenTelemetry's auto-instrumentation context object only contains two values by default, the trace ID and parent span ID. To correctly attach these session IDs, we needed to edit the context object being passed from service to service. Adding the session ID needed to occur on the instrumented application, before the span data was exported to the Retrospect API, otherwise, it would be too late and there would be nothing connecting the events and spans.
The (brute-force) approach would be adding code to every single route handler, to edit the context object for every single service. To save developers time and reduce the risk of mistakes, we decided to write a Custom Span Processor and custom middleware so the user only needs two lines of code per instrumented service.
![]()
Custom Span Processor & Middleware
Auto instrumentation by default handles span creation and processing with the Simple Span Processor. After a span is created but before it is exported, the processor adds metadata (trace and parent ID) to the baggage object in the current span's context object before exporting the span. We had to override that default span processor with our Custom Span Processor to attach Retrospect's metadata.
In order to attach Retrospect's metadata to each span, we created custom middleware called customBaggage. After a request is received, the customBaggage middleware pulls the Retrospect metadata from the request headers and adds the metadata to the baggage object in the current span's context object.
Before the span gets exported, our Custom Span Processor extracts Retrospect's metadata from the baggage object in the current span's context object and attaches the metadata as attributes on the span. Since the context object is not being exported as part of the span, the metadata had to be added as attributes on a span which does get exported automatically.
See the diagram below for a visual explanation.
![]()
Default span attributes:
- traceId
- id
- timestamp
- duration
Span attributes added by Retrospect's Custom Span Processor:
- trigger_route
- user_id
- session_id
- request_data
In addition to the customer span processor and middleware, we had to modify our data pipeline to handle spans associated with database requests. Because of a bug in OpenTelemetry for certain Node versions Instrumentation, database spans lost the context object despite our middleware and Custom Span Processor. The database spans had trace IDs but no user or session IDs.
As a result, we inserted these database spans into a separate table from the main spans table. From there, a cron job would find the missing metadata by checking for a span in the main spans table with matching trace IDs. It copies the metadata from the correctly formed span and adds the metadata to the appropriate database spans before inserting the database span data into the main span table. Once inserted, that span data is removed from the separate database span table.
Once we did this, now we're storing unique Session IDs. This is what our data looks like:
![]()
However, this reveals the next problem...
Sessions are still too big
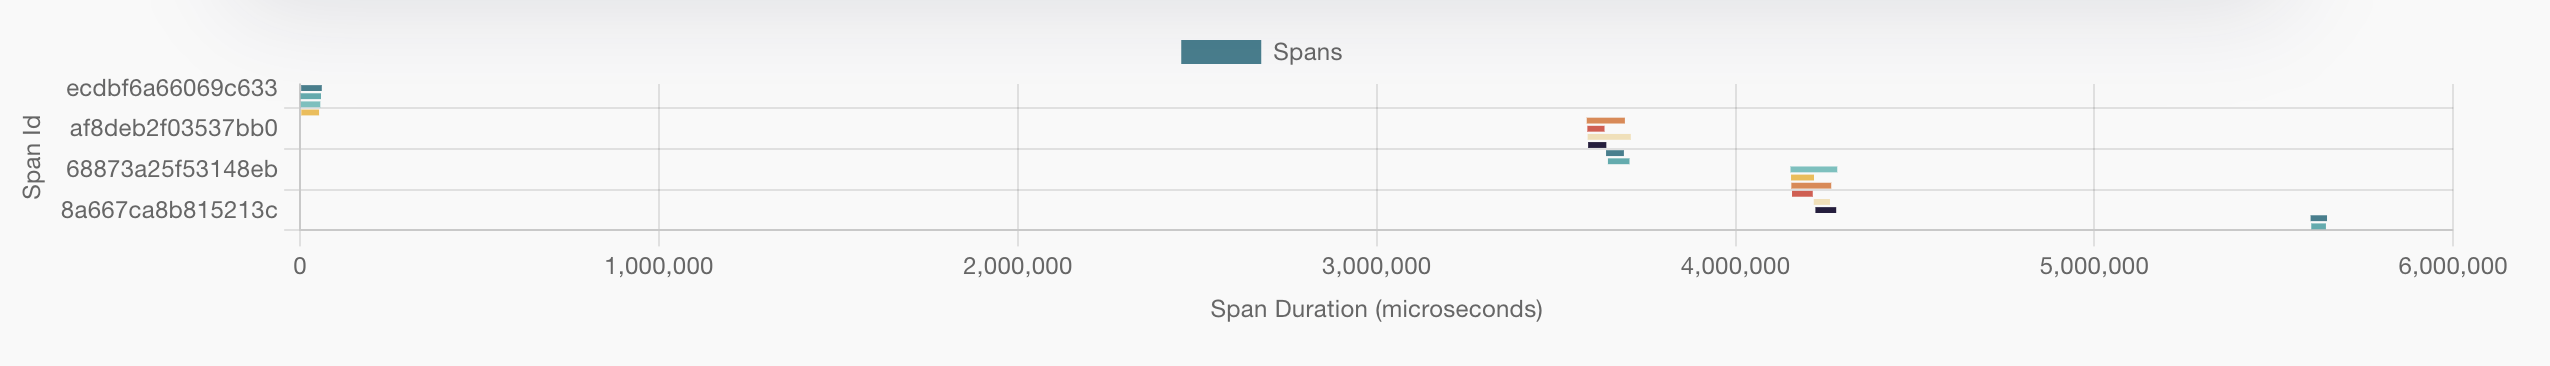
The first thing we saw when we graphed traces and events by session ID is that the traces were too spread out over time to be immediately useful. Additionally, there were too many events to be easily understood.
![]()
Our goal was to tell the story of how client-side user operations led to server-side workflows, but the session view is too broad to see which events led to which traces. If we want to see what those events are, how do we organize them?
To organize event and trace data, we introduced a new intermediate, organizational layer of abstraction. We came up with the concept of a 'chapter' which is not too different from being like a 'mini session'. This lets us connect each trace with the user events which led up to it.
![]()
6.2 Data Requirements
Although we used MongoDB for initial testing, when it came to querying, as well as scalability, we identified several key measures that we needed to account for, and MongoDB wasn't going to work long term.
We identified the following:
- Our data is structured and relational.
- The DB needs to support a high write volume.
- The solution must scale easily.
We eventually came to use Apache Cassandra as our database solution, but let's explore how we came to this conclusion.
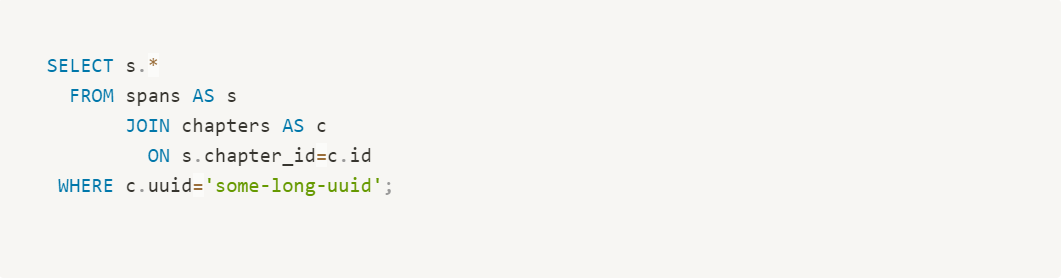
Structured, relational data
A relational database would work well for our structure, but relational databases tend to be too slow for write operations. Many NoSQL solutions would not work with our intended queries, though, because they tend to distance themselves from relational data, whereas our data matches a relational paradigm very well: every span span ID belongs to a root span ID, a chapter ID, a session ID, and a user ID. These one-to-many relationships would work well for queries later on:
![]()
Such an architecture would involve a message queue, and a service worker would consume the message queues and perform the necessary read/write operations into a database like Postgres.
However, this only works for bursty traffic not sustained traffic. More importantly, as more users arrive, the relational databases might not be able to scale as necessary.
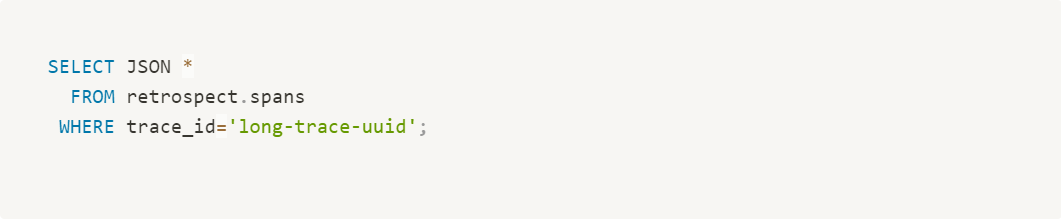
Another option would be to use a document store, and just post documents there. MongoDB certainly boasts fast write times. However, querying large amounts of documents can grow rather cumbersome. Our data isn't exactly key-value oriented. Trying to run queries on large document sets would involve searching very, very many documents, and we want to avoid that.
![]()
The at-rest data storage is a little less elegant, but it satisfies this requirement. We can query a large amount of data in single-table SQL-like rows.
But what about writes?
High write volume
Users create a ton of events. We needed either a high-performant message queuing system or a database that can support very high write speeds.
Message queuing has several advantages in this case. It can scale vertically rather well and serves as a holding buffer for data. It would theoretically allow us to store data in a traditional relational database, which writes at its own speeds.
The bottleneck here would be the destination. Once the messages are in the queue, they still have to be sent somewhere. And while a message queue certainly allows for a lengthy buffer, it still has to be processed. This leads to a worry, that if traffic is sustained and not simply bursty, a traditional relational database would be writing at full speed and never catch up.
Scaling can help with some of this, but not all of it. Right out of the box, we need fast writing.
As it turns out, Cassandra is specifically intended towards high-write scenarios. Because data is stored in single tables that don't link or relate to others, there is very little in the way of overhead: data is chunked together according to partition keys to facilitate node clustering and data duplication but writes happen at blazingly fast speeds per individual node.
But does it scale?
Scaling Options
Even though Retrospect is designed for small applications, when Bob needs to expand his webserver network, the database cluster needs to have expansion options as well. We don't want to limit Bob's growth by declaring that our app doesn't scale. However, with our data input, the number of read-write operations will likely require scaling if Bob starts getting tens of thousands of visitors every day.
This is where the message queuing loses its footing. Even though the message queue itself would scale vertically incredibly well, the real issue is with the data at rest. The destination has to scale, both in size and in writes.
If we imagine that Bob's Shop is a growing business, then let's assume success: what works for him now will need to work in two years when he has more customers. No matter what write speeds the database can offer, with the amount of traffic coming in, the database will need growth options in the future, as Bob's Shop expands across the globe.
There certainly are database growth options for almost any database solution, but we don't want Bob to have to deal with sharding or anything else complicated. Bob will certainly have to handle some amount of Retrospect-related service as his network grows, but we don't want him too in the weeds. He should be able to quickly and easily expand, if at all possible.
Cassandra offers linear scaling with built-in, schema-defined data partitioning and replication. Cassandra clusters can work together and talk together. And with linear scaling, if Bob needs to suddenly double his amount of throughput handling, he can quickly add double the amount of Cassandra nodes to keep up, and the cluster handles itself.
6.3 UI Challenges
Our goal when designing the Retrospect UI was to provide the minimum number of features needed for debugging. We wanted to avoid overwhelming the developer, so we needed a UI that was easy to search and move between front-end and back-end data. Every diagram and table needed to be simple, succinct, and provide maximum information. We consulted working software engineers on every aspect of the UI to ensure every feature was needed.
Minimum necessary features
We decided to offer the minimum necessary features so that developers could make the fewest number of decisions while debugging. Enterprise alternatives like Sentry and Fullstory already offer broad feature sets, so our value is in making the simplest possible tool.
With that in mind, there were two broad categories of features that we decided not to include: user experience analytics and back-end metrics. The former include data like rate click percentages, browser heat maps, and user satisfaction scores. The latter were things like service performance times, event and trace volumes, or errors over time. Finally, we also opted against any alerting functions. Retrospect aims to speed up a developer's debugging once they are aware of an issue, rather than finding them themselves.
One unusual feature that we chose to include was session replay. Although this is not a standard tracing feature, we thought it was critical to our debugging use case. Reproducing a bug is often the last line of defense for developers, and session replay is significantly better than relying on user-provided information. By adding observability to the front-end, we can solve seemingly impossible bugs caused by unexpected interactions between the front-end and back-end.
Easy to search
The second goal of our UI was quickly finding the necessary information. To do this, we made it possible to search spans and events by the most common pieces of information: time, request data, DOM data, status code, span type, and trigger route. Further, within each span and event are clickable chapter and session IDs, so developers can easily navigate between searching for data and drilling down into it.
Within these chapter and session views, we added visual elements like waterfall charts and session replay, making it possible for developers to understand the state of a trace or browser session at a glance. Instead of scrolling through a list of spans or events, the user can immediately see how these data points relate to each other.
Finally, we have a dashboard with spans and events that resulted in errors. This can point developers to potential bugs before they even need to search.
7. Additional Retrospect Use Cases
Once Retrospect is set up, the user can solve a variety of problems, not only when services become unresponsive but also when they are underperforming. To show that, we will return to Bob's e-commerce application.
7.1 Shipping Service is Down
Like in the example from the very beginning, the customer experiences an error when they go to checkout. The customer does not know this, but the order submission does not go through because the shipping service has gone down.
![]()
Now that Bob has instrumented his application with Retrospect, this debugging process becomes significantly faster and more predictable. Once Bob receives the complaint from his customer, he can immediately look for a matching span. In this case, he knows from the complaint that the error occurred just after 03:00 CST on July 30th. As a result, he filters for spans after that time, sorts them in ascending order, and looks for the first span with a 400 or 500 status code. When he inspects the associated request data, he can see that the customer email property matches the email from the complaint and knows that he has found the correct span.
![]()
Once Bob finds the span, he can click on the chapter ID to get a better picture of the problem.
![]()
Inside the chapter view, he can see the trace containing that span, as well as a list of all the other spans in that trace. In this case, the last span in the trace is the likely source of the problem, given that it could only have been triggered if the previous spans succeeded. This is confirmed by sorting the list of spans by status code. The child span with a 500 status code has the same span ID as the last child span in the trace.
![]()
If you click on the last span in the bar chart, you can see it refers to the shipping service. From here, Bob would be able to SSH into the compute hosting the shipping service and fix it.
7.2 Payment Service is Delayed
In addition to showing you when a service has returned a 4xx/5xx status code, Retrospect can also show you when a service is delayed. In this example, the customer experiences a 5-second delay when they go to checkout. (The GIF has been sped up)
![]()
When Bob receives the complaint, he can search the list of spans for one that contains the customer's name, Dale. After opening the span details card, Bob can confirm that this is the correct span by checking the customer_email property on the span. Inside the span details card, Bob can see an unusually long span, so he clicks on the chapter ID to see the trace more closely.
![]()
The spans in the chart are clickable so Bob can click on the longest span and see it was a little over 5 seconds. Further down in the span details, Bob can see the requested URL, indicating which service caused the delay.
![]()
Span details example
A span details card provides metadata information such as span ID, trace ID, chapter ID, session ID, and user ID. Additionally, it provides import log information about the service like status code, time of the request, duration of the request, the path that triggered the request, and request data.
![]()
The span tags section contains more information about the request that aids debugging such as status text, user agent information and, additional http information.
![]()
8. Installation
8.1 Client Instrumentation
There are three steps to instrument the client to allow Retrospect to collect front-end events.
The first step is to install the "retrospect-client-agent" with npm on the client.
![]()
![]()
The second step is to update the configuration file provided by the "retrospect-client-agent" package. Change the endpoint property to point to the location of Retrospect's api server that we provide.
![]()
The third step is to import the Recorder object from the client-agent into the index.js file (in the client) and start the Recorder by calling the init method.
![]()
8.2 Server Instrumentation
There are four steps to instrument the server to allow Retrospect to collect traces.
First, install the "retrospect-client-agent" with npm on each service that calls another service.
![]()
In the example below, Bob only has to install the "retrospect-server-agent" on his "api" service. But if Bob had a service like "shipping" that called an "email" service, then Bob would have to install the "retrospect-client-agent" on the shipping service for Retrospect to track the trace across the email service and collect telemetry data on the shipping service.
![]()
The second step is to update the configuration file provided by the "retrospect-server-agent" package. Change the serviceName to the name of the service you're instrumenting. Then update the value of the dbOptionns to true if the service uses any of the listed databases. Lastly, change the endpoint property to point to the location of Retrospect's api server that we provide.
![]()
The third step is to import the customBaggage from the "retrospect-server-agent" package into the server startup file such as the index.js file and use it as middleware.
![]()
The fourth step is to update the start script of the server to start the tracing.js file before starting the startup file (ex. index.js file). Use the command node -r retrospect-server-agent/tracing.js followed by the name of the server startup file.
![]()
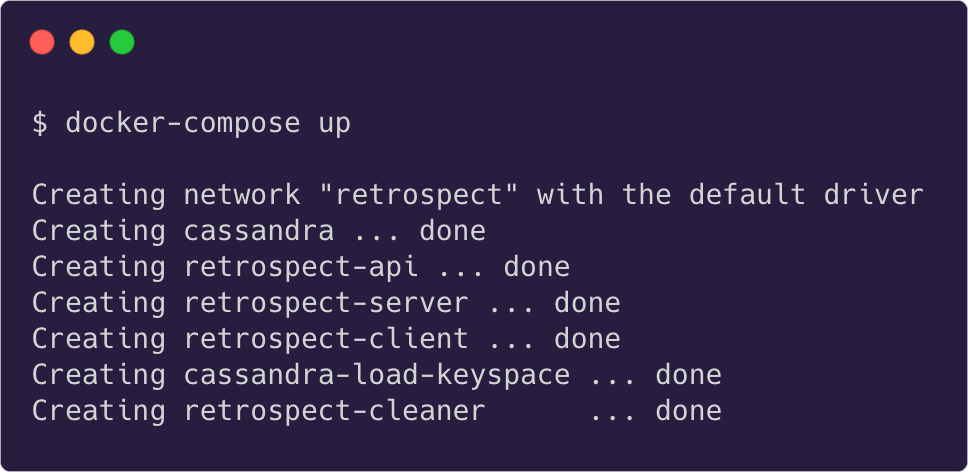
8.3 Deploying Retrospect
To deploy Retrospect's infrastructure, download the docker-compose.yml file and data.cql file from Retrospect's "deploy" repo. Then run docker-compose up either locally or on a virtual machine like a Digital Ocean droplet.
This will create a retrospect docker network containing Retrospect's UI, Cassandra instance, scheduled maintenance tasks, and an API server. Once this network is running, confirm that the endpoint property in both "retrospect-server-agent" and "retrospect-client-agent" point to the domain that hosts the Retrospect docker network.
![]()
![]()
9. Future Work
And that's Retrospect! We're an open-source full-stack observability tool that collects traces and session recordings in a single UI. We're proud of what we've done so far, but we realize there are future work items that would strengthen the product.
- Securing the API server — adding user authorization to data reads and UI access
- Improve options for scaling — add tools to further help expand the DB cluster
- Support more languages on the back-end — currently, OpenTelemetry supports JS, Go, Python, Java, and .NET.